The French interior ministry has announced the final count of votes cast in the French presidential elections, both in mainland France and abroad, giving Socialist Party candidate François Hollande a total score of 51.62% and the incumbent conservative candidate Nicolas Sarkozy 48.38%. But that is of course far from the full picture, presented here in Mediapart’s graphic guide to the key figures, how the country voted region by region, the regional turnout rates and how all this compared with previous elections.
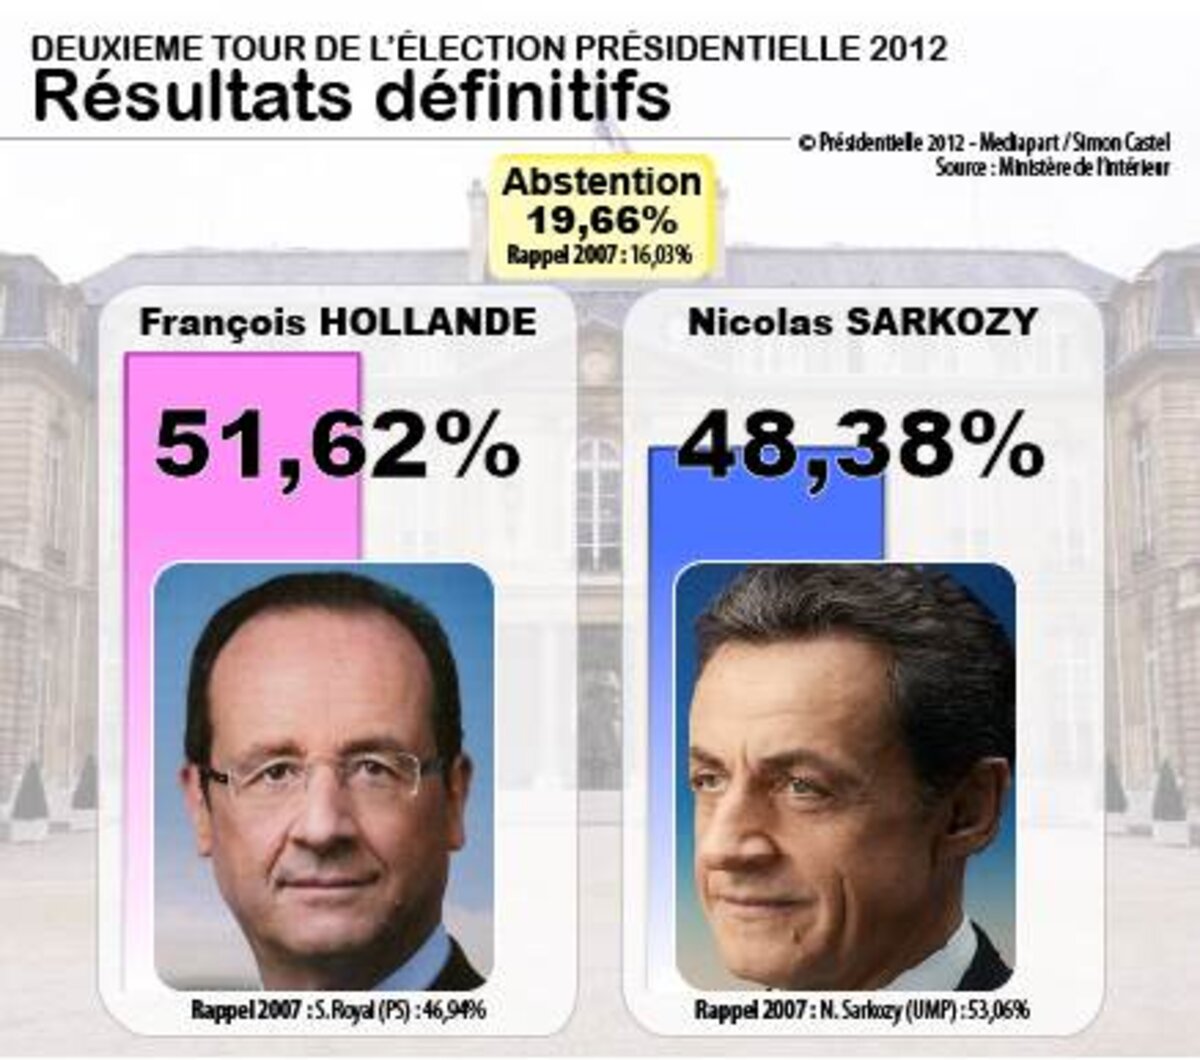
The key figures:
- The total number of voters registered for the elections was 46,066,506, out of a total population of 65.3 million).
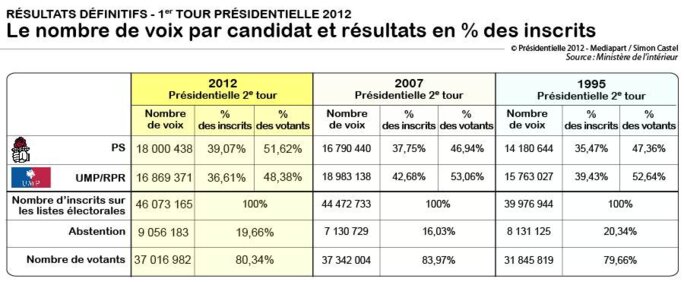
- In terms of the number of votes cast, 18,000,438 went to Holland, and 16,869,371 to Sarkozy. That represents a difference in favour of Hollande of 1,131,067.
- The turnout of registered voters was 80.34% (therefore giving an abstention rate, which is more often cited in France than turnout, of 19.66%). That represented some 9 million people.
- The final votes counted overnight were the 1.147 million cast by French expatriates registered with expatriate constituencies (for example, in the UK these are London and Edinburgh). The turnout was particularly low among this group, at 62.2% (abstention rate of 57.8%).
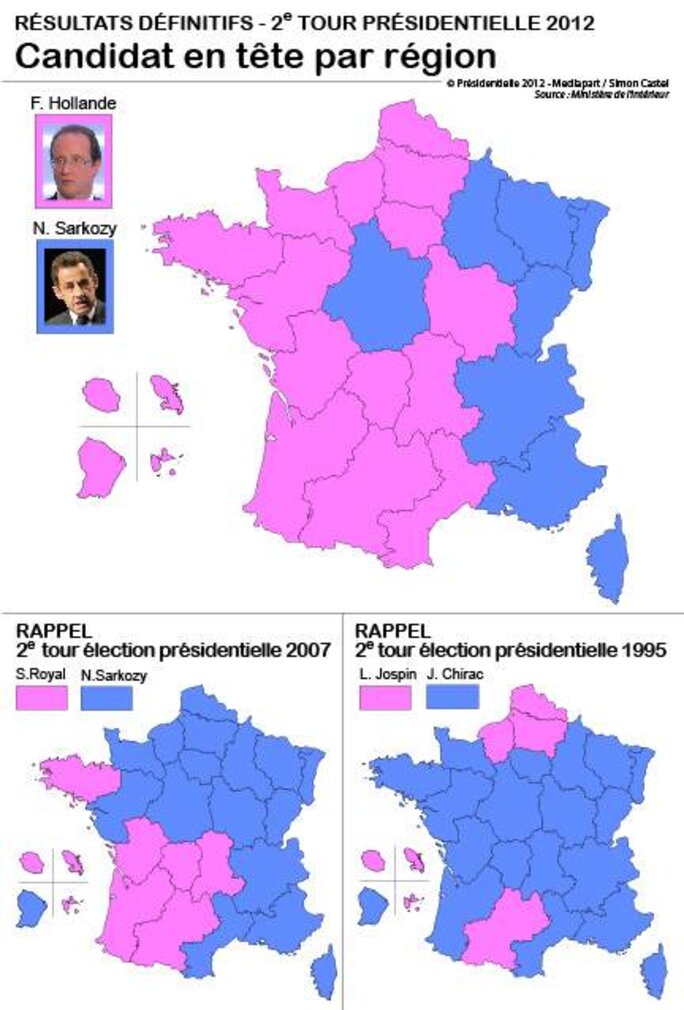
The following map (immediately below) shows in which regions which of the two candidates won a majority of votes cast.
This is accompanied by two smaller maps underneath comparing the results of the final play-off in the presidential elections in 2007 and 1995. In both these elections, the final round was a contest between a Socialist Party candidate - Ségolène Royal in 2007, Lionel Jospin in 1995 - and that of the mainstream Right party (now the UMP, formerly the RPR) – namely Nicolas Sarkozy in 2007 and Jacques Chirac in 1995.
The islands to the left of the maps are regions made up of French overseas territories; clockwise from top left these are La Réunion, Martinique, Guadeloupe and French Guyana.
Agrandissement : Illustration 2

The presidential election in 2002 has not been included because of the incomparable context. Then, the final round saw Chirac face far-right leader Jean-Marie Le Pen. Jospin had been eliminated in the first-round voting when, in a movement of protest at the outgoing prime minister’s perceived drift to the Right, the left-wing vote was spread across several alternative Left candidates. The Socialist Party, along with many others of the Left, called for a vote for Chirac to block Le Pen, who was defeated in a landslide 82.21% - 17.79% victory for Chirac.
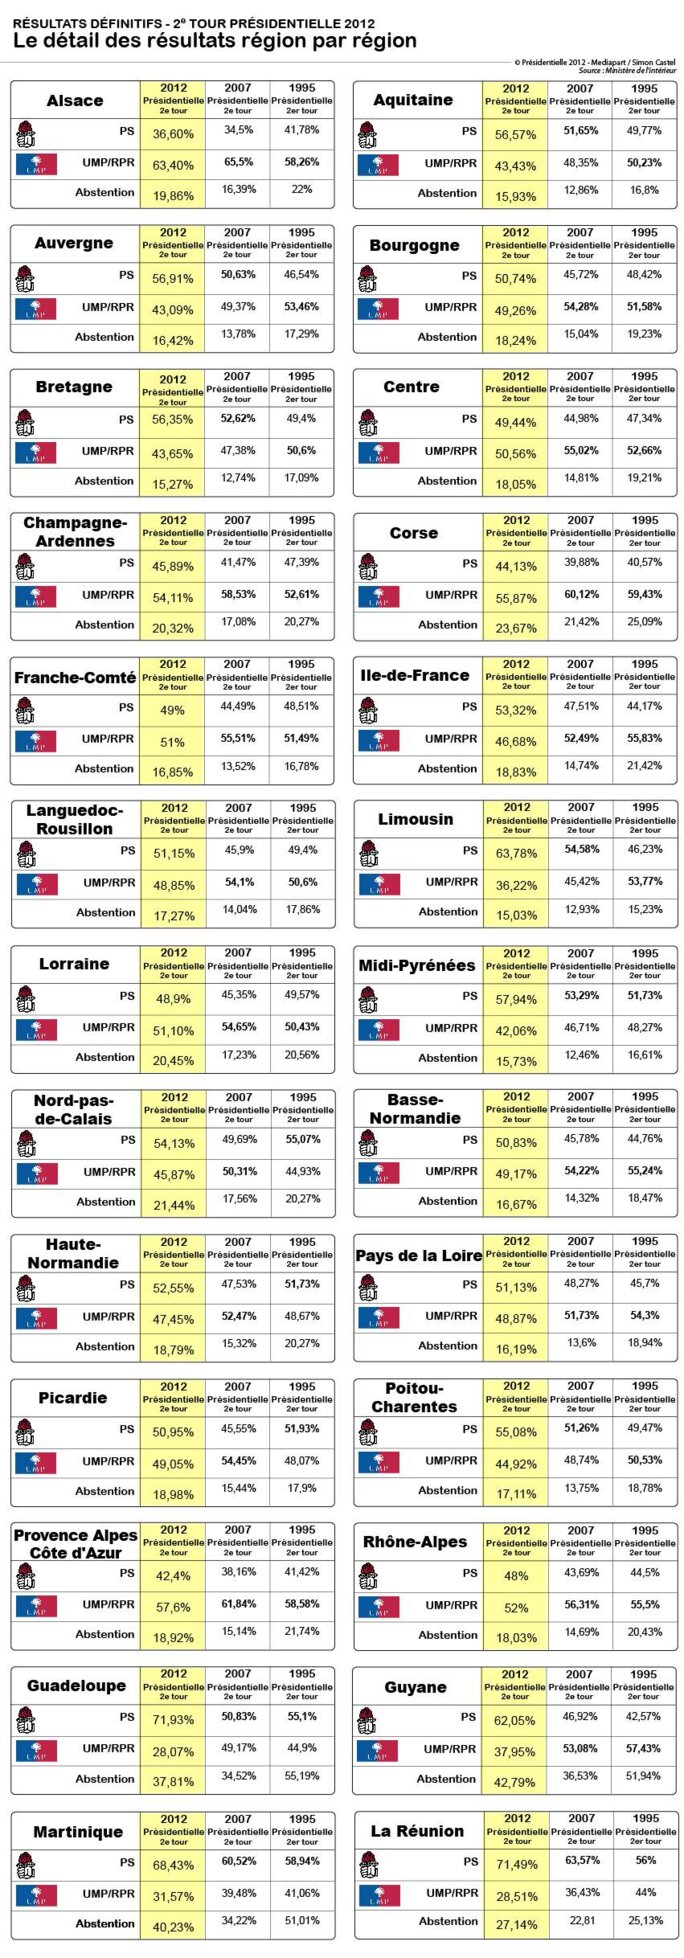
Immediately below here is a detail of the score of each candidate in every region. Again, there is a comparison with the scores of the Socialist Party (PS) candidate and that of the mainstream conservative Right party (now the UMP, previously the RPR) in the elections held in 2007 and 1995.
Agrandissement : Illustration 3

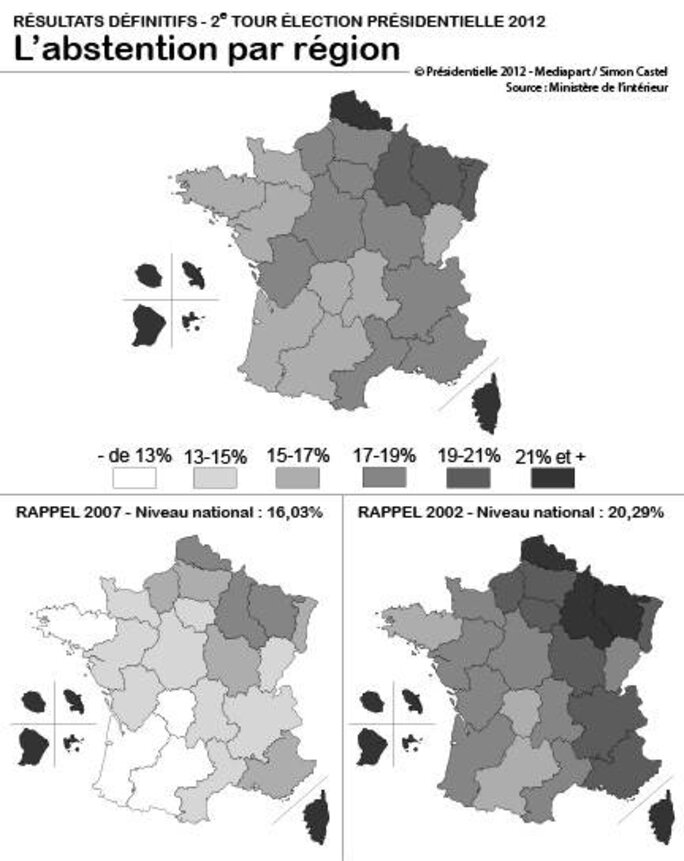
Below is a map illustrating the abstention rate, region by region, again with comparisons of the elections in 2007 and 1995. The measurement ranges from less than 13% (white) to 21% or more (black).
Finally, below is a file showing, top left to right, votes cast for each candidate (nombre de voix), the percentage this represents among registered voters (% des inscrits) and the percentage this represents of all votes cast (% des votants) in this year’s presidential elections and those of 2007 and 1995. To the left, top to bottom, is the party of the candidate (PS = Socialist Party, UMP/RPR = mainstream conservative party), the number of voters registered for each election (Nombre d’inscrits sur les listes électorales), the turnout measured by the number of abstentions (Abstention) and the number of those who voted (Nombre de votants).
Agrandissement : Illustration 5


